The Fundo Verde Data and Monitoring System is the result of a partnership with Instituto Municipal de Urbanismo Pereira Passos. It is a relational database associated with a geographic database structured with geoprocessing technology using the ArcGIS software, which allows integration with shapefiles for processing, storing and viewing georeferenced data on the world wide web. With these resources, it is possible to visualize the cartographic representation of the Cidade Universitária campus and measure the data on its consumption of water and electricity.
The database is managed by a PostgreSQL system using the PostGIS plugin, which enables communication between all collected data, as well as analyses and spatial queries, as it supports geometric features in its tables. Fundo Verde’s database is fed by different sources organized in two types of systems. The first system comprises information directly related to consumption data that are obtained on a regular basis, such as electricity consumption, waste production, internal mobility, water consumption etc. The second data source consists of the satellite systems installed by Fundo Verde, such as the water meters installed at the Technology Center and the photovoltaic system in the solar car park, which provide data continuously.
The decision to develop a monitoring system with spatial representations was based on the fact that this type of analysis helps us understand the studied area and contributes in decision-making. With this purpse in mind, Fundo Verde started a partnership with Instituto Municipal de Urbanismo Pereira Passos (IPP), in which IPP provides access to various updated information from its database, such as orthophotographs (photographs that correct all distortions that are typical of aerial photographs), while Fundo Verde contributes with updates on data regarding the area of the Cidade Universitária campus.
The project was divided into two stages: mapping of land usage, buildings (institutional and non-institutional), roads and bicycle paths, and publication of data on water and energy consumption of the institutional buildings.
Stage 1 – Mapping of land usage, buildings (institutional and non-institutional), roads and bicycle paths
In 2014, we started the process of updating and collecting data in order to map information such as: land usage, buildings (institutional and non-institutional), roads and bicycle paths of the Cidade Universitária campus with the aid of IPP’s orthoimagery from 2013. Such mapping made it posible for us to extract information such as the total area of urbanized and green spaces in our campus, as well as the percentage of areas with buildings or parking lots, as shown in the table below.
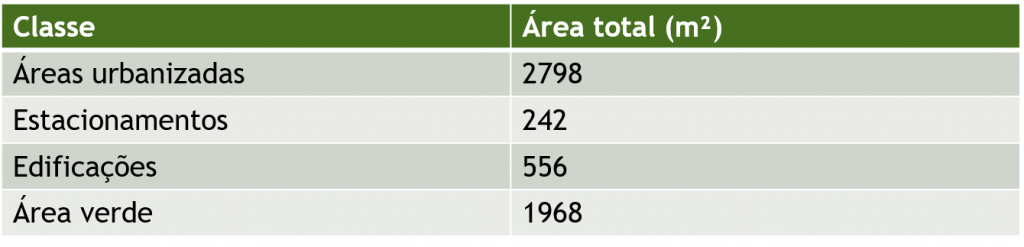
Under the Urbanized Areas item, we included: buildings, parking lots, infrastructure facilities and leisure areas, as well as industrial, residential and non-built areas. Under the Green Spaces classification, we included the following types of vegetation: shrub- tree, grassy-woody and mangrove.
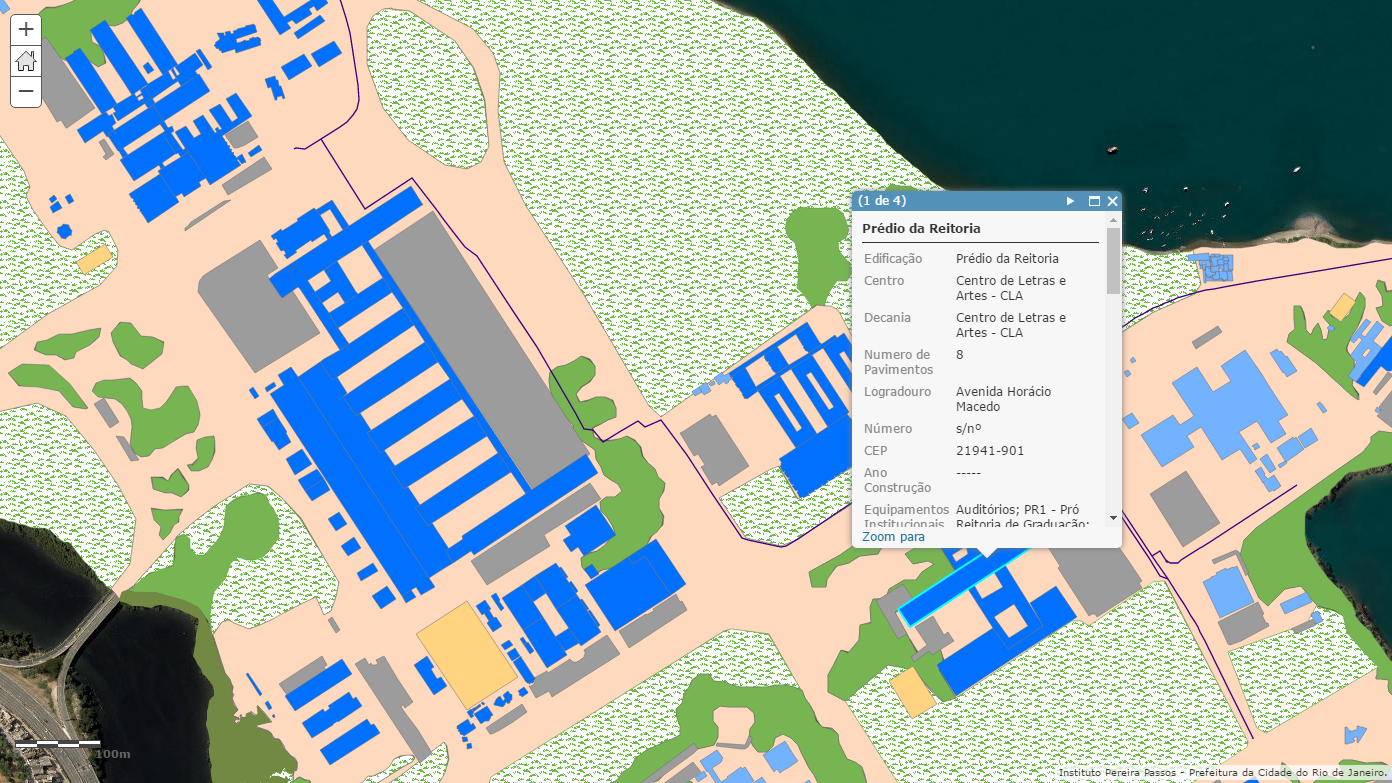
The analysed institutional buildings at UFRJ were divided into blocks according to our University's academic centers. For these buildings, we collected information such as undergraduate and graduate courses, telephone numbers of such units, the Dean’s Office in charge, among others. The organization of such data facilitates our knowledge and understanding on each of the units at Cidade Universitária.
The development of this database was completed with the publication of all collected information by using ArcGIS Online, with the support of IPP, in March 2015. Check the data in question by clicking here.
Stage 2 – Publication of data on water and electricity consumption of institutional buildings
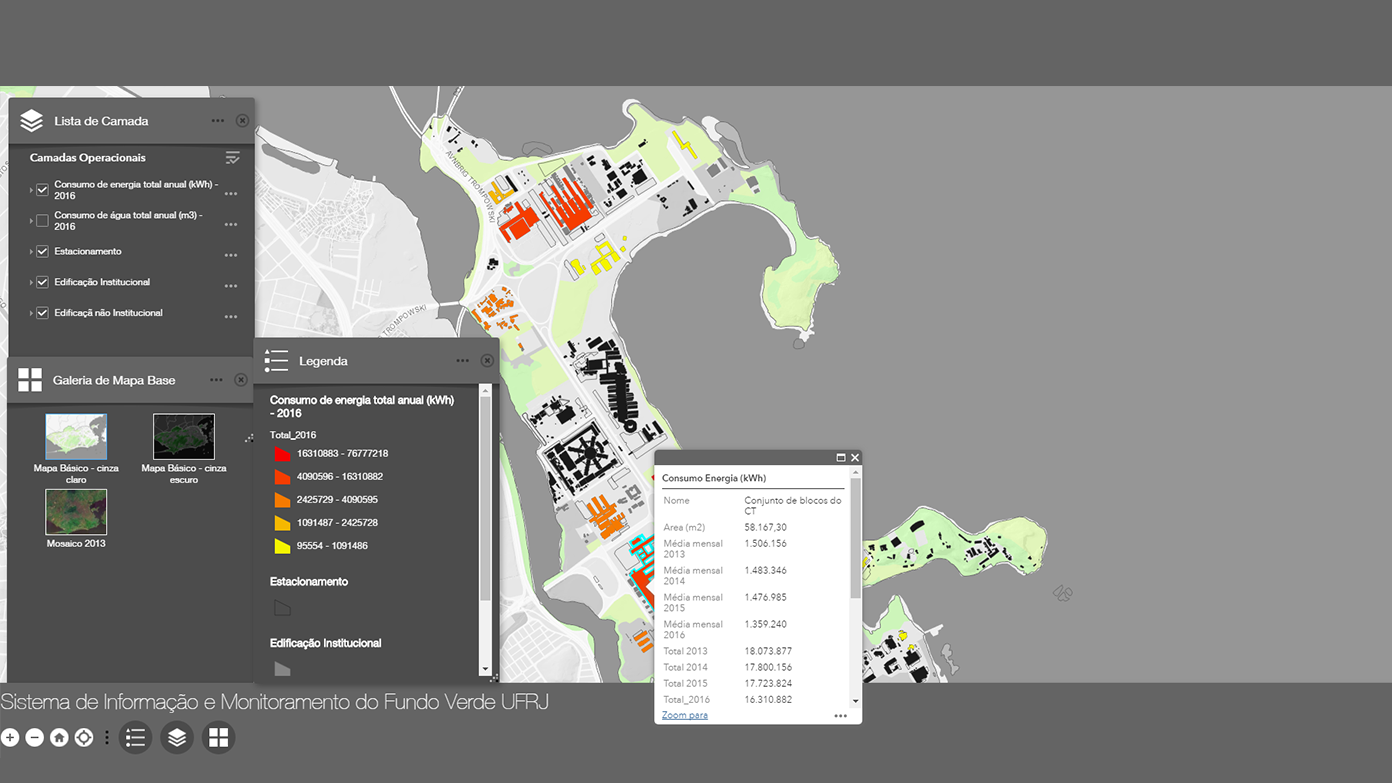
On January, 2017, with the support of IPP, we published the indicators regarding water and electricity consumption of the institutional buildings at the Cidade Universitária campus for the period ranging from 2013 to 2016. Such data was obtained from bills issued by the State Company for Water and Sewage (CEDAE) and by the electricity concession company (LIGHT Serviços de Eletricidade).
The consumption of water and electricity, according to the available consumption meters, are represented in different spatial data layers, which indicate the organizational entities grouped in a more comprehensive manner than the institutional buildings of Cidade Universitária. Such groups are called Geographical Centers in the case of water consumption, and Light Centers for energy consumption.
The data in question can be checked by clicking here.